What U Should Know Before Planning Your 2026 BFA Purchasing Strategy
If U are purchasing Brown Fused Alumina (BFA) for resin bond grinding wheels, vitrified grinding wheels, coated abrasives, or refractory applications, market timing directly affects your cost structure and production stability.
The following analysis is based on China’s full-year 2025 export data (Jan–Dec).
The purpose is simple:
Help U understand where the market stands — and how to position your sourcing strategy.
1️⃣ 2025 Monthly Export Volume: Clear Second-Half Slowdown
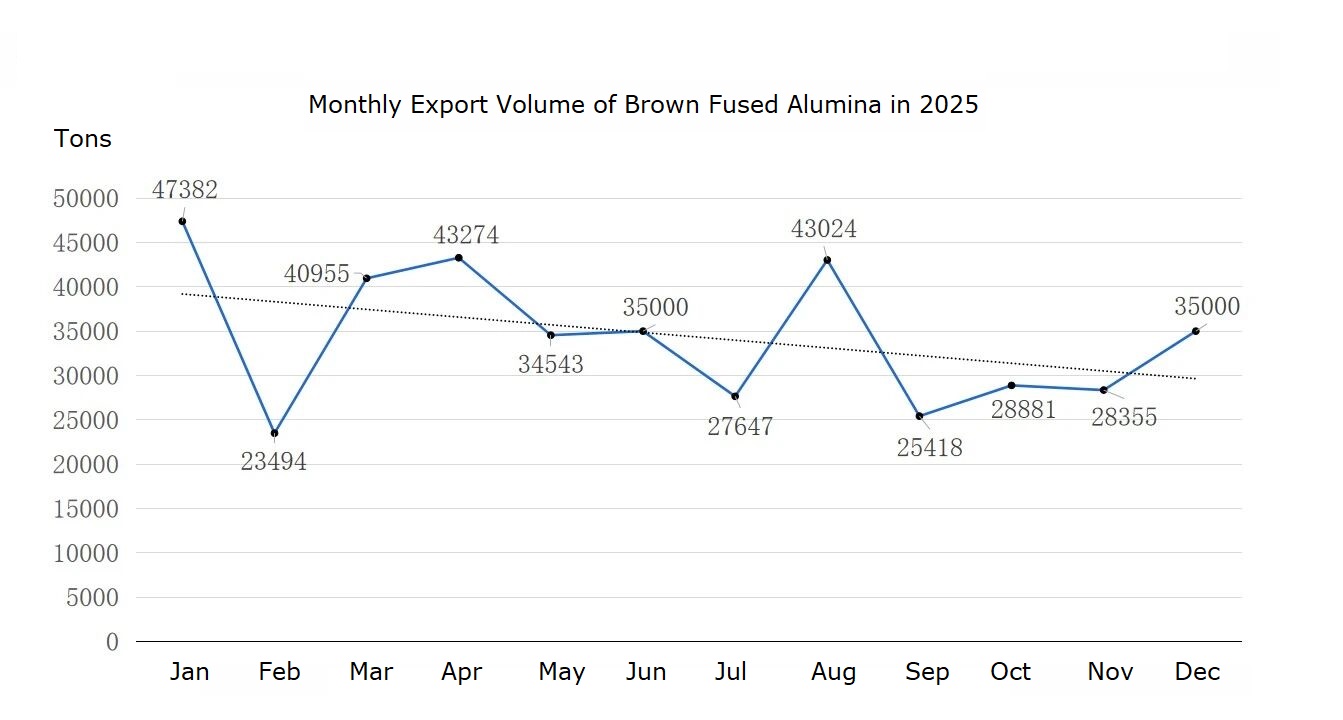
Total 2025 Export Volume: 412,973 MT
Key signals:
- January peak: 47,382 MT
- February seasonal drop (Chinese New Year effect)
- March recovery above 40,000 MT
- From May onward: gradual softening
- August temporary rebound
- July, September, October, November all below 30,000 MT
- December mild recovery
What This Means for U
The first half of 2025 remained relatively stable.
But from Q3 onward, export volume weakened.
This usually indicates:
- Global demand slowdown
- Inventory digestion at downstream factories
- Cautious purchasing behavior
If U experienced slower order flow in late 2025, the data confirms it was a global trend — not an isolated case.
2️⃣ 2025 Export Value: Price Pressure Continues
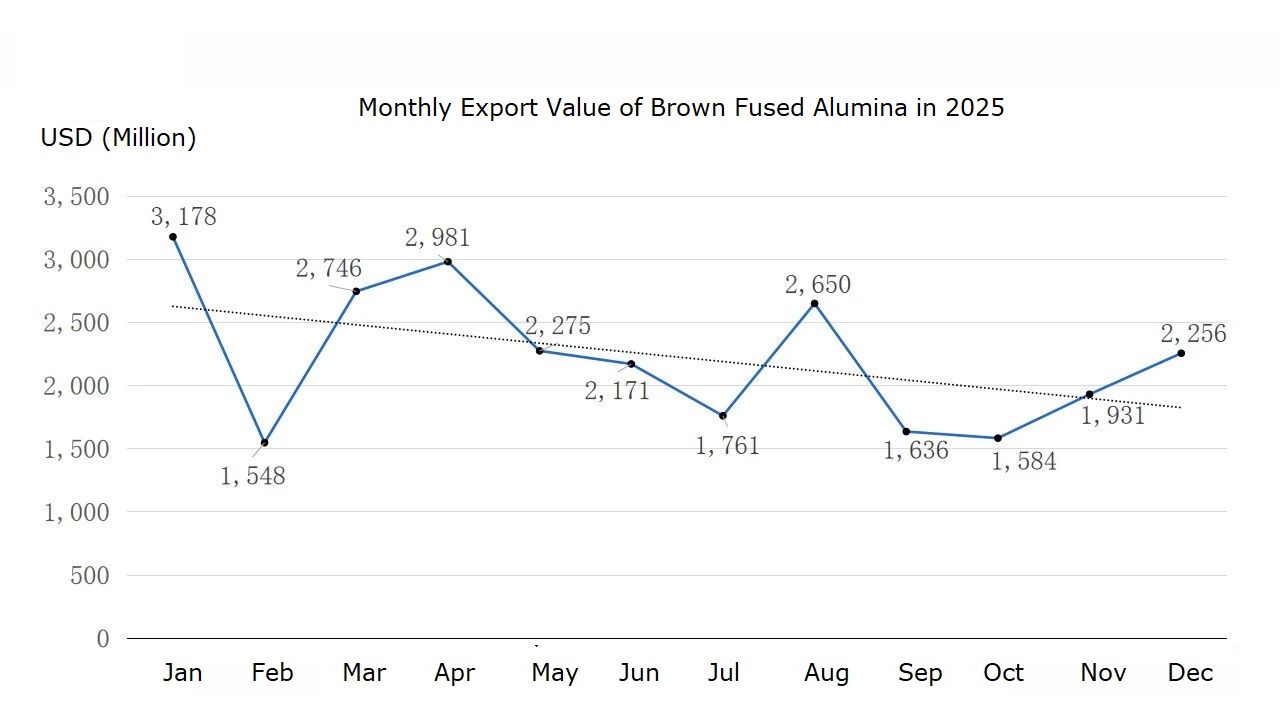
Total 2025 Export Value: USD 267.17 million
Highlights:
- January highest value month
- February sharp correction
- March–April rebound
- Mid-year softening
- Limited recovery in Q4
Although volume fluctuated, overall export value continued declining compared to previous years.
Interpretation for Procurement Teams
This reflects:
- Competitive pricing environment
- Reduced pricing power on the supply side
- Stable but cautious demand
For buyers, 2025 was a year of relatively better negotiation leverage compared to 2023.
3️⃣ Three-Year Volume Comparison: 2024 Peak, 2025 Correction
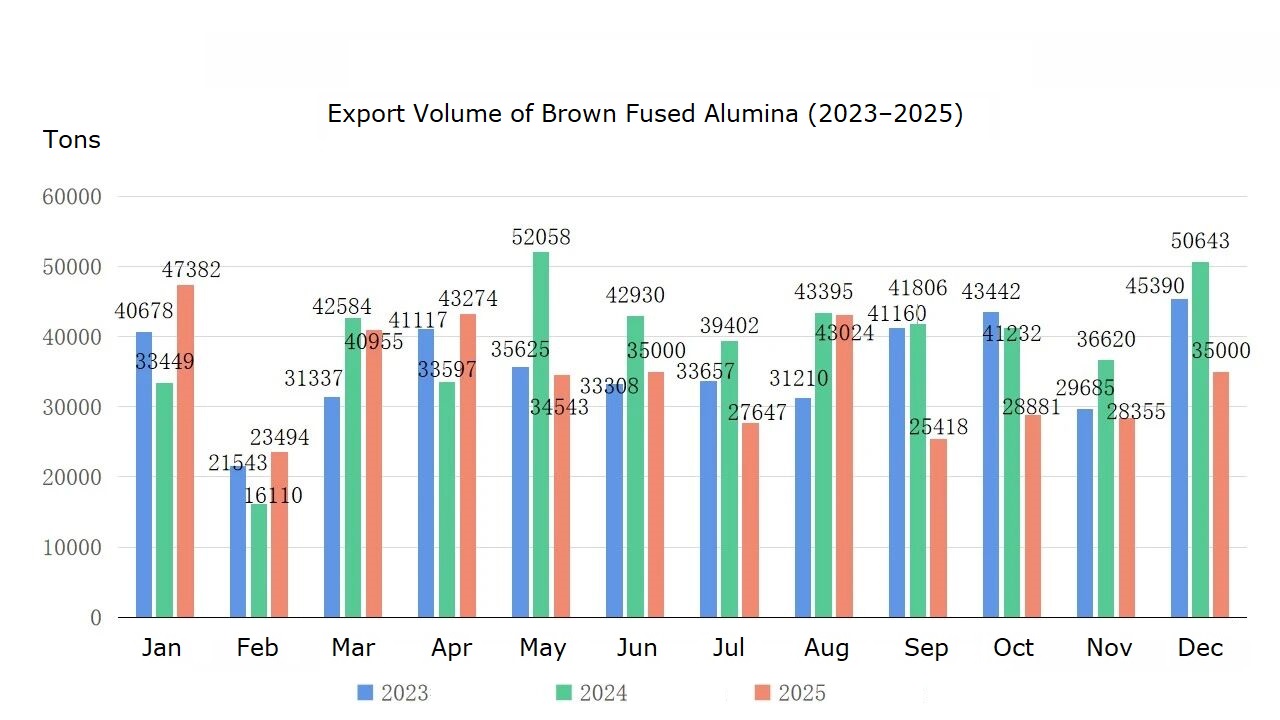
| Year | Export Volume |
| 2023 | 428,152 MT |
| 2024 | 473,826 MT |
| 2025 | 412,973 MT |
Trend pattern:
- 2024 reached peak export volume
- 2025 corrected downward
- First 8 months of 2025 similar to previous years
- September–December clearly weaker
What U Should Watch
When volume declines but capacity remains stable, competition intensifies.
That typically leads to:
- More aggressive pricing
- Flexible negotiation terms
- Faster response times from suppliers
4️⃣ Export Value Comparison: Structural Price Adjustment
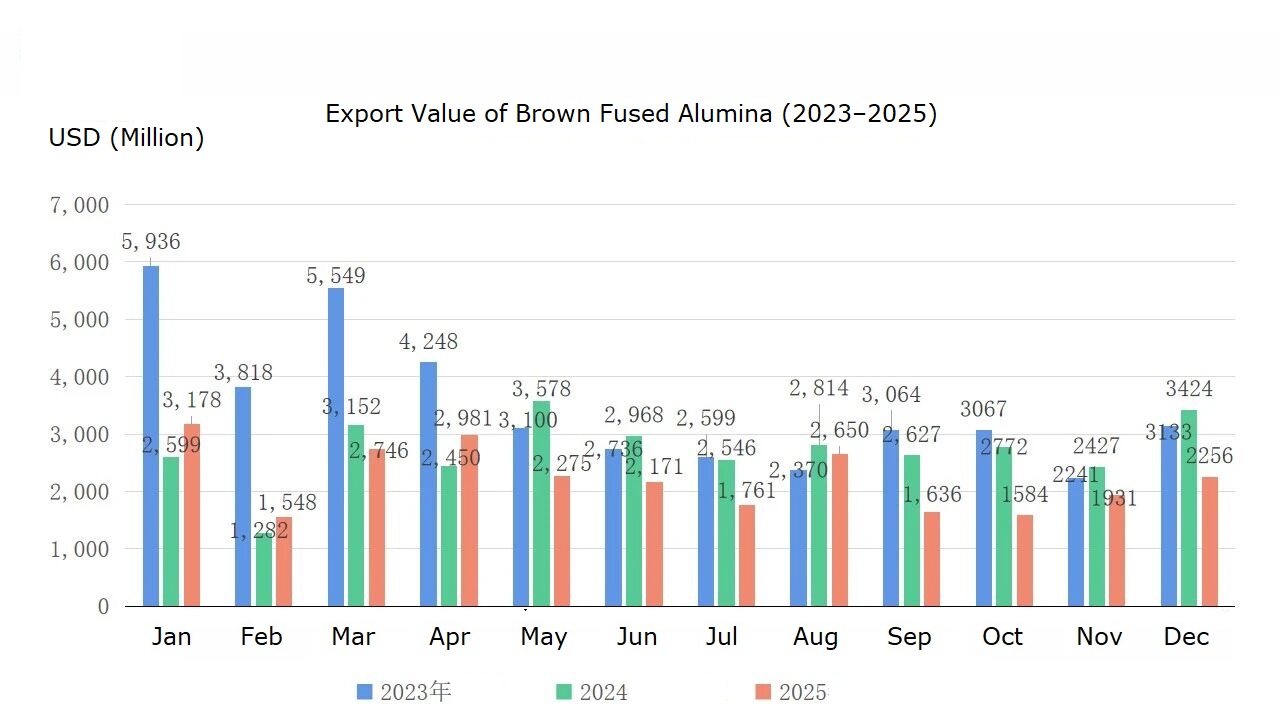
| Year | Export Value |
| 2023 | USD 418.61M |
| 2024 | USD 326.39M |
| 2025 | USD 267.17M |
Despite 2024 having the highest export volume, total value was significantly lower than 2023.
2025 continued downward.
Why This Matters to U
The extreme pricing phase of 2023 has fully corrected.
Energy cost spikes and raw material tightness seen earlier are no longer at peak levels.
This creates:
- More predictable cost structure
- Improved budgeting clarity
- Better long-term contract planning
5️⃣ Main Import Markets: US, Japan, India Remain Core
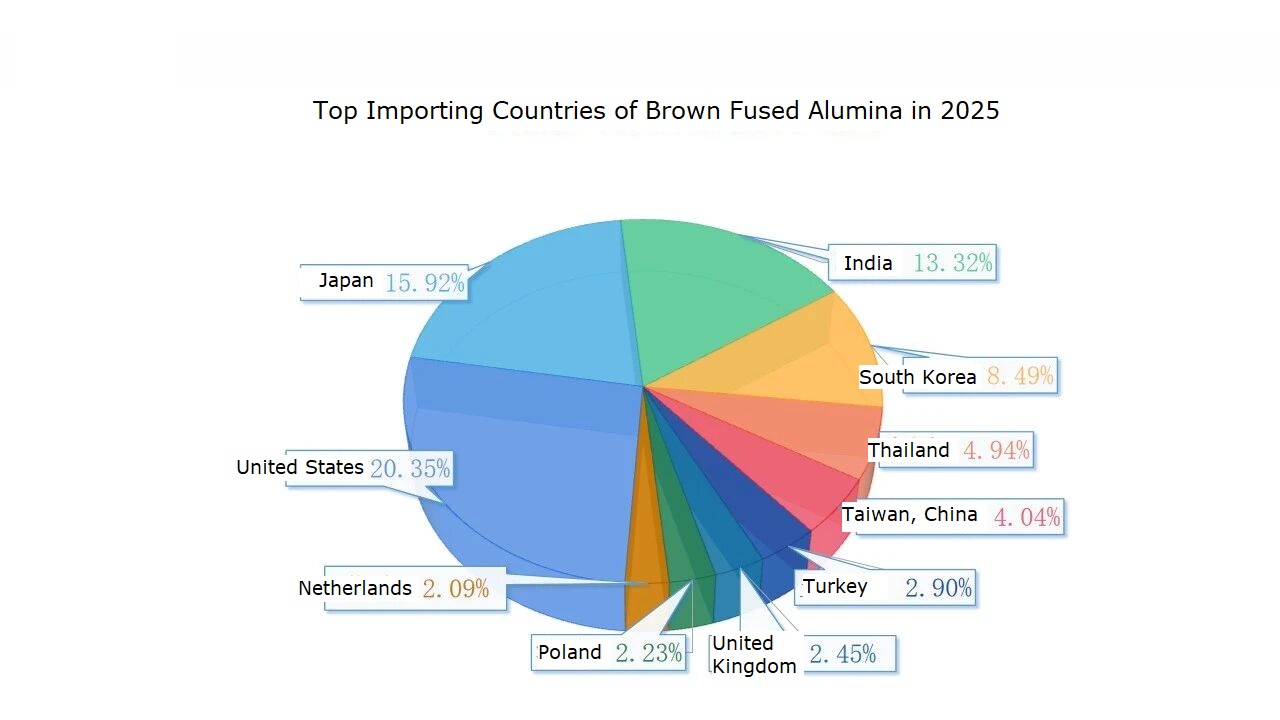
Top markets in 2025:
- USA: 20.35%
- Japan: 15.92%
- India: 13.32%
- South Korea: 8.49%
These are all major grinding and industrial manufacturing regions.
Market Signal
Demand remains structurally strong in:
- North America
- Japan
- India
This confirms BFA remains essential in grinding, refractory, and blasting industries globally.
6️⃣ Supply Concentration: Henan Remains the Core
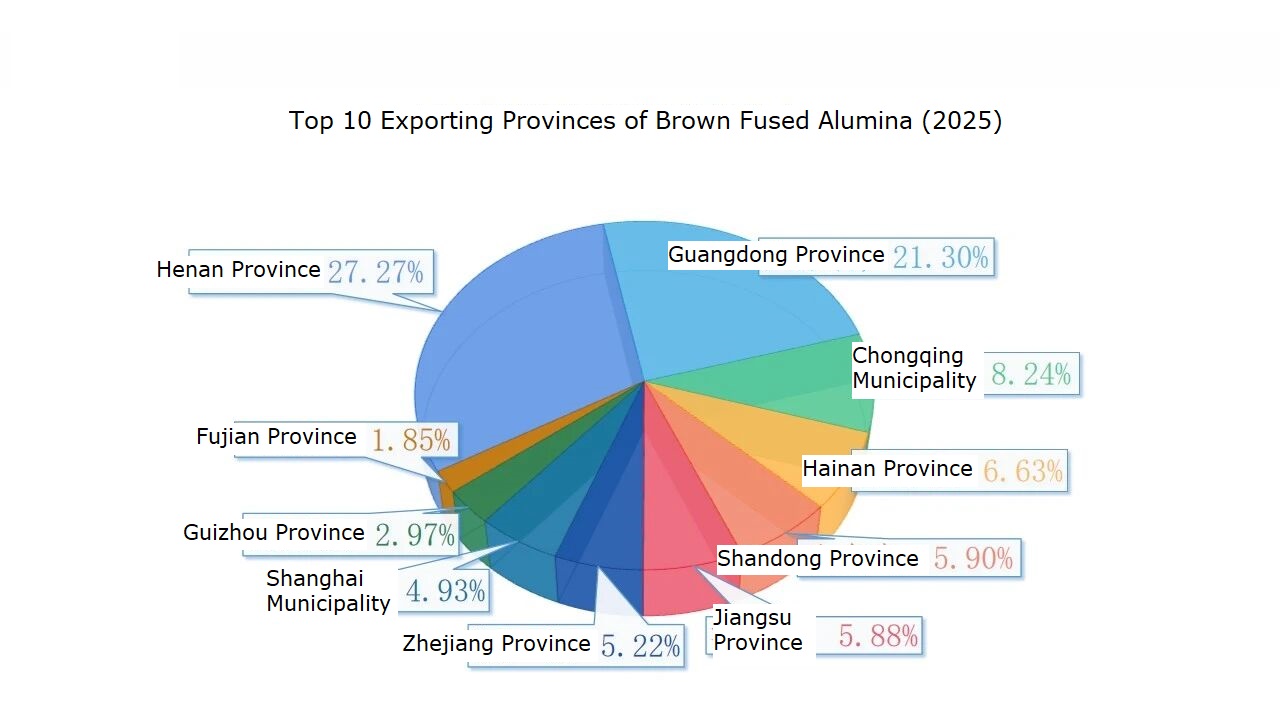
Top exporting regions:
- Henan Province: 27.27%
- Guangdong Province: 21.30%
- Chongqing: 8.24%
Henan remains the production backbone.
For buyers, this means:
- Energy policy in Henan directly affects global supply
- Environmental regulations remain a key variable
- Supply chain monitoring should include regional policy signals
7️⃣ Trade Structure: Stable and Transparent
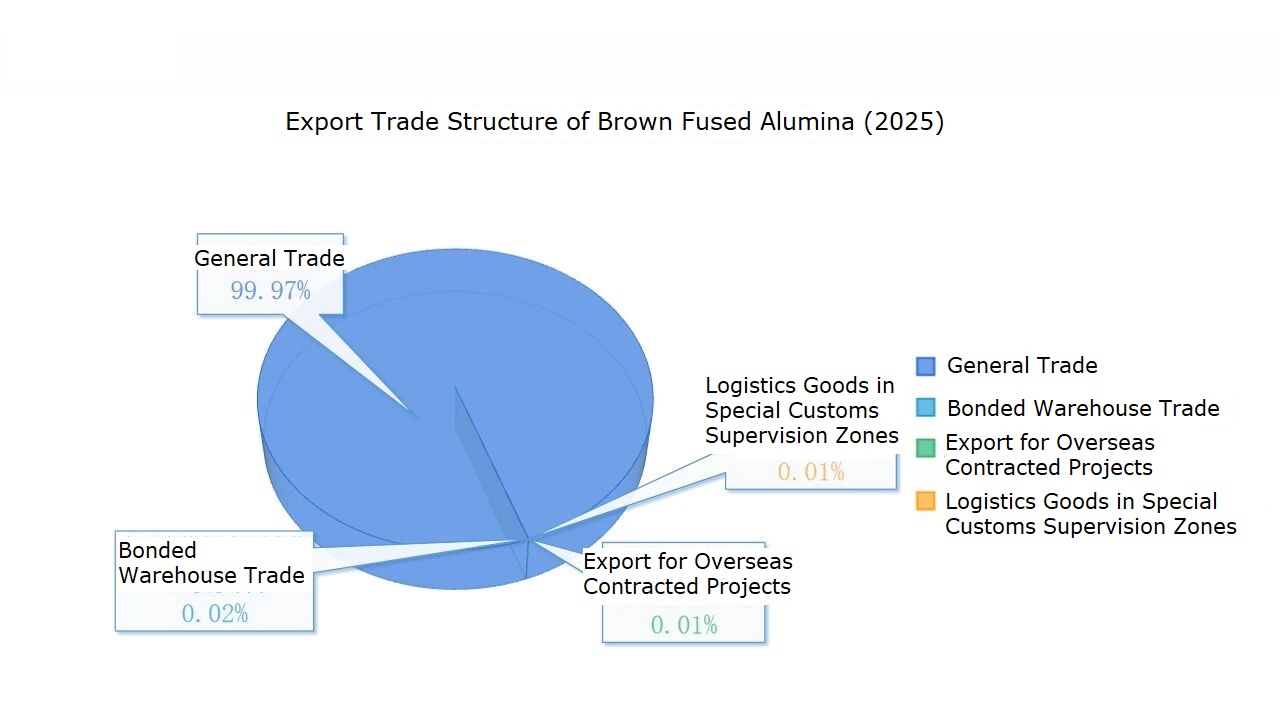
General trade accounts for 99.97%.
This indicates:
- No major structural distortion
- Market-driven export behavior
- Transparent supply chain flow
What Should U Do in 2026?
Based on 2025 data, the market is currently:
- More balanced than 2023
- More competitive than 2024
- Less volatile than previous price spikes
For procurement teams, this environment favors:
✔ Locking in stable annual cooperation
✔ Evaluating supplier consistency, not only price
✔ Monitoring Q3 demand signals carefully
✔ Avoiding overstock during weak demand cycles
Final Message for BFA Buyers
Brown Fused Alumina is not only about price per ton.
It influences:
- Grinding efficiency
- Wheel life
- Production yield
- Downstream cost stability
The 2025 data shows a market entering a rational adjustment phase.
This is usually the best time to:
- Re-evaluate supplier partnerships
- Optimize contract structures
- Secure long-term stable cooperation
If U would like deeper breakdowns by grit range (F12–F220), application segment, or 2026 forward outlook, further insights can be prepared based on your market focus.
The right timing always reduces total procurement cost.
Reduce your total procurement cost — not just the price per ton. Let’s evaluate a long-term BFA cooperation plan that protects your margins and stabilizes your supply.